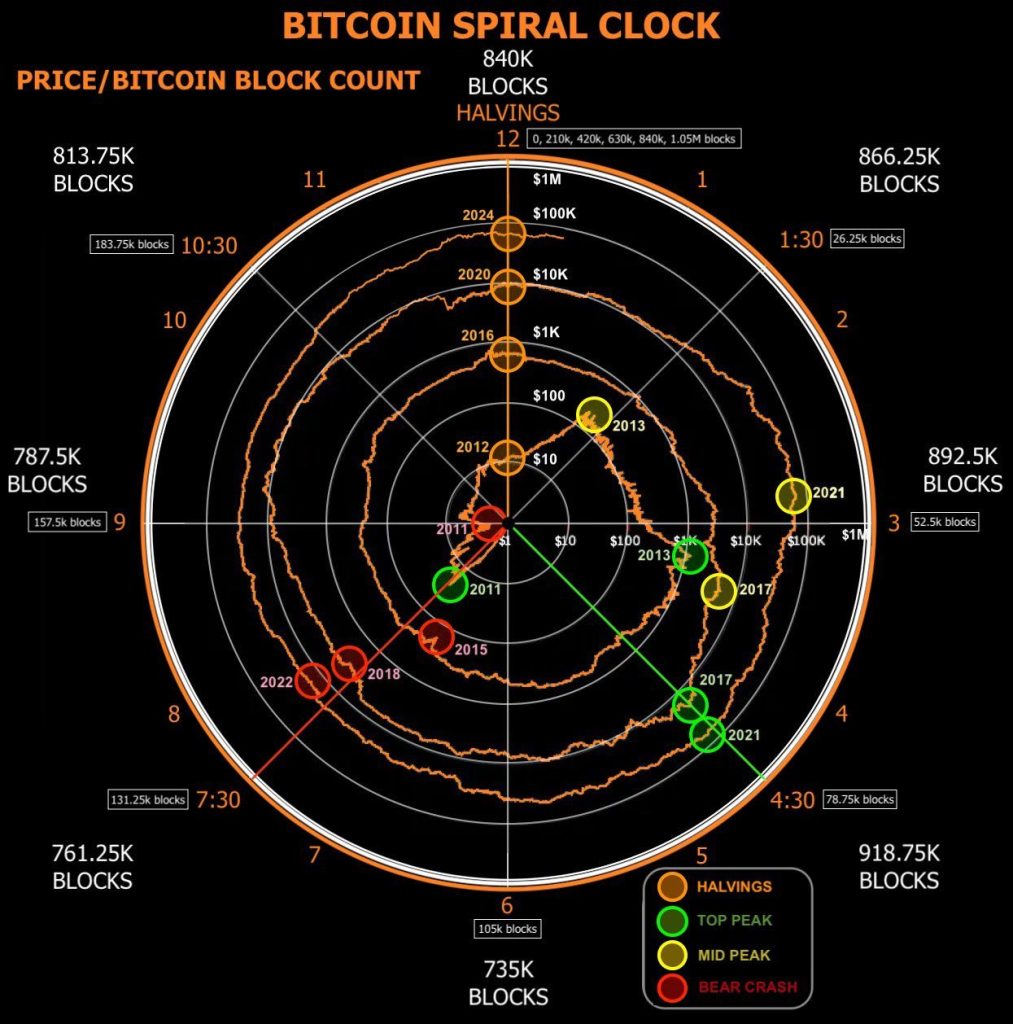
The Bitcoin Spiral Clock offers a compelling visual representation of Bitcoin’s price history, block count, and significant events such as halvings and price peaks. Recently, John Osterman’s commentary added a timely perspective on the current state and future expectations of Bitcoin, emphasizing the importance of key milestones and market behaviors.
The Bitcoin Spiral Clock: A Historical Overview
The Bitcoin Spiral Clock charts the journey of Bitcoin from its inception, marking key points in its timeline. These points include block halvings, price peaks, and major market crashes. Each cycle on the clock highlights Bitcoin’s consistent yet volatile progression towards higher valuations.
Key Elements of the Bitcoin Spiral Clock
Block Count and Halvings:
- Blocks: The Bitcoin network records transactions in blocks, with each block representing a segment of time.
- Halvings: Approximately every four years, the Bitcoin network undergoes a halving event, where the reward for mining new blocks is cut in half. This reduces the rate at which new Bitcoins are introduced into circulation, creating a supply shock that has historically driven price increases.
Price Levels:
- The spiral tracks Bitcoin’s price from $1 to $1M, with significant milestones marked along the way. These price levels provide a framework for understanding Bitcoin’s growth trajectory and market behavior.
Peak and Crash Markers:
- Top Peaks (Yellow): These markers indicate the highest price points during bull markets.
- Mid Peaks (Green): These are intermediate peaks that occur between major bull runs.
- Bear Crashes (Red): These markers denote significant price drops that typically follow the peaks, indicating the start of bear markets.
Current Status and Future Projections
According to John Osterman, the Bitcoin network is currently at the 846,400th block, with 44 days passed since the last significant milestone at 12 o’clock on the Bitcoin Spiral Clock (the 2024 halving). The next major milestone is at 1:30, corresponding to the 866,250th block, expected around October 19, 2024. Osterman’s advice to “keep stacking SATS” (accumulating amounts of Bitcoin) underscores a common sentiment among Bitcoin enthusiasts to continue accumulating Bitcoin in anticipation of future price increases.
Analyzing Historical Patterns
Cyclical Price Movements:
- The Bitcoin Spiral Clock reveals Bitcoin’s cyclical nature, characterized by periods of rapid price increases followed by significant corrections. These cycles are largely influenced by the halving events that reduce the supply of new Bitcoins.
Impact of Halvings:
- Each halving event has historically been followed by a substantial bull run. For example, the 2012 halving preceded a rise from $12 to over $1,100 by late 2013. Similarly, the 2016 halving saw Bitcoin’s price increase from around $650 to nearly $20,000 by the end of 2017. The previous halving in 2020 has led to prices exceeding $60,000 in 2021. The current halving in 2024 led to prices above $70,000.
Price Peaks and Crashes:
- The clock highlights significant peaks and subsequent crashes. For instance, Bitcoin’s price peaked in late 2017 before crashing in early 2018, marking the end of a major bull run. The pattern suggests that while Bitcoin’s price can increase rapidly, it is also prone to significant corrections.
As of now, Bitcoin is in a phase of recovery and consolidation following the 2021 peak. This phase typically precedes the next significant price increase, often catalyzed by the halving events. Investors and enthusiasts like John Osterman are closely watching the next milestone at 1:30 on the Bitcoin Spiral Clock, indicating the 866,250th block.
Investment Implications
Long-Term Investment Strategy:
- Historical patterns suggest that accumulating Bitcoin during bear markets or consolidation phases can yield substantial returns in the long term. The upcoming halving in 2024 is anticipated to trigger another bull run, making the current period potentially favorable for accumulation.
Understanding Volatility:
- Bitcoin’s history of dramatic price swings underscores the importance of understanding its volatility. Investors should be prepared for significant fluctuations and consider strategies like dollar-cost averaging to mitigate risk.
Market Timing Challenges:
- While the Bitcoin Spiral Clock provides a framework for understanding Bitcoin’s market cycles, accurately timing the market remains challenging. Long-term holding strategies often outperform attempts to time the market.
A Different Kind of Clock
The Bitcoin Spiral Clock is a valuable tool for visualizing Bitcoin’s historical price trends and the influence of halving events. John Osterman’s commentary adds a timely perspective, highlighting the importance of upcoming milestones. As Bitcoin approaches its next major milestone in October 2024, investors are encouraged to continue accumulating Bitcoin in anticipation of future growth.
While the historical patterns provide insights, the inherent volatility of Bitcoin necessitates a cautious and informed investment approach. By understanding these patterns and preparing for volatility, investors can better navigate the complexities of the Bitcoin market.
Author Profile

- Ex-community moderator of the Banano memecoin. I have since been involved with numerous cryptocurrencies, NFT projects and DeFi organizations. I write about crypto mainly.
Latest entries
- June 6, 2025NewsWireElon Musk to Decommission SpaceX Dragon after Trump Threat
- December 9, 2024Stock MarketMaster the Time Value of Money Financial Concept
- November 18, 2024Stock MarketFinancial Ratios Guide to Measuring Business Performance
- November 11, 2024NewsWireLabour’s UK Budget: A Fiscal Smirk of Contempt for Working People


