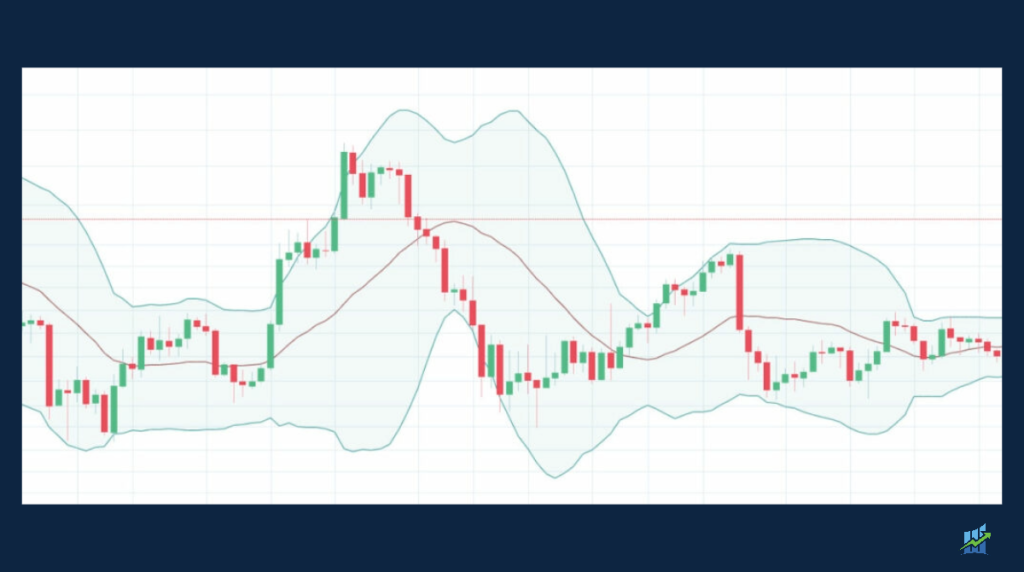
Bollinger Bands are a widely used technical analysis tool in stock trading to assess price volatility and identify potential buy or sell signals. This guide will explain the concept in detail, including the formula, various trading scenarios, interpretation, and best practices for using Bollinger Bands effectively.
Bollinger Bands: An Overview
Developed by John Bollinger in the 1980s, Bollinger Bands are a set of three lines plotted on a stock price chart, consisting of a simple moving average (SMA) and two standard deviation bands above and below the SMA.
The primary purpose of Bollinger Bands is to measure the stock’s volatility and identify overbought or oversold conditions, which can help traders make better-informed trading decisions.
Bollinger Bands Formula
The formula for calculating Bollinger Bands is as follows:
- Middle Band (SMA): Calculate the simple moving average (SMA) for a given period (typically 20 days).
- Upper Band: Add two standard deviations of the stock’s price to the SMA.
- Lower Band: Subtract two standard deviations of the stock’s price from the SMA.
Bollinger Bands essentially represent a range within which the stock price is expected to fluctuate, with the bands widening during periods of high volatility and contracting during periods of low volatility.
Examples of Bollinger Bands in Trading Scenarios
Here are some examples of how Bollinger Bands can be used in different trading scenarios:
- Identifying Overbought/Oversold Conditions: When the stock price touches or crosses the upper band, it may indicate overbought conditions, suggesting a potential sell signal. Conversely, when the stock price touches or crosses the lower band, it may indicate oversold conditions, suggesting a potential buy signal.
- Bollinger Band Squeeze: A Bollinger Band squeeze occurs when the bands contract significantly, indicating low volatility. This situation often precedes a significant price movement, either upward or downward. Traders can use other technical indicators, such as volume or momentum oscillators, to confirm the direction of the breakout.
- Riding the Bands: In a strong uptrend, the stock price may consistently ride the upper band, while in a downtrend, it may consistently ride the lower band. Traders can use this information to identify the prevailing trend and trade accordingly (e.g., buying in an uptrend and short-selling in a downtrend).

Interpreting Bollinger Band Readings
When interpreting Bollinger Band readings, traders should consider the following:
- Band Width: The width of the bands can provide insights into the stock’s volatility. Wider bands indicate higher volatility, while narrower bands indicate lower volatility.
- Price Action Relative to Bands: Traders should analyze price action relative to the bands to identify potential buy or sell signals. For example, a stock price crossing above the middle band (SMA) could signal a potential buy, while crossing below the middle band could signal a potential sell.
- Confirmation with Other Technical Indicators: Bollinger Bands should be used in conjunction with other technical indicators, such as RSI or MACD, to increase the accuracy of buy or sell signals.
Best Practices and Considerations for Using Bollinger Bands
Traders should keep the following best practices and considerations in mind when using Bollinger Bands:
- Adjust Band Settings: Depending on the stock and market conditions, traders may need to adjust the period for the SMA or the number of standard deviations used to calculate the bands.
- Avoid Overreliance: While Bollinger Bands can provide valuable insights, traders should not rely solely on them for making trading decisions. Combining Bollinger Bands with other technical indicators and fundamental analysis can help improve the overall accuracy of buy or sell signals.
- Risk Management: As with any trading strategy, proper risk management is crucial when using Bollinger Bands. Traders should use stop-loss orders to limit potential losses and protect their capital.
In conclusion, Bollinger Bands are a versatile and valuable tool for technical analysis in stock trading. By understanding the concept, formula, and various trading scenarios, traders can effectively use Bollinger Bands to identify trends, assess price volatility, and make informed buy or sell decisions. However, it is essential to combine Bollinger Bands with other technical indicators and follow best practices to ensure success.
Author Profile

- Lucy Walker covers finance, health and beauty since 2014. She has been writing for various online publications.
Latest entries
- April 25, 2025Global EconomicsWhistleblowers Unmask Schwab’s Toxic WEF Secrets
- April 9, 2025Global EconomicsTariff Tensions Drive Market Volatility
- March 18, 2025Global EconomicsRed in Name Only: Labour’s War on the UK Working Class
- March 7, 2025SatoshiCraig Wright Banned from UK Courts with Civil Restraint Order


